I. Empirical View
I.1 Historical Perspective
Global literacy has grown substantially in the last two centuries
While the earliest forms of written communication date back to about 3,500-3,000 BCE, literacy remained for centuries a very restricted technology closely associated with the exercise of power. It was only until the Middle Ages that book production started growing and literacy among the general population slowly started becoming important in the Western World.
1 In fact, while the ambition of universal literacy in Europe was a fundamental reform born from the Enlightenment, it took centuries for it to happen. It was only in the 19th and 20th centuries that rates of literacy approached universality in early-industrialized countries.
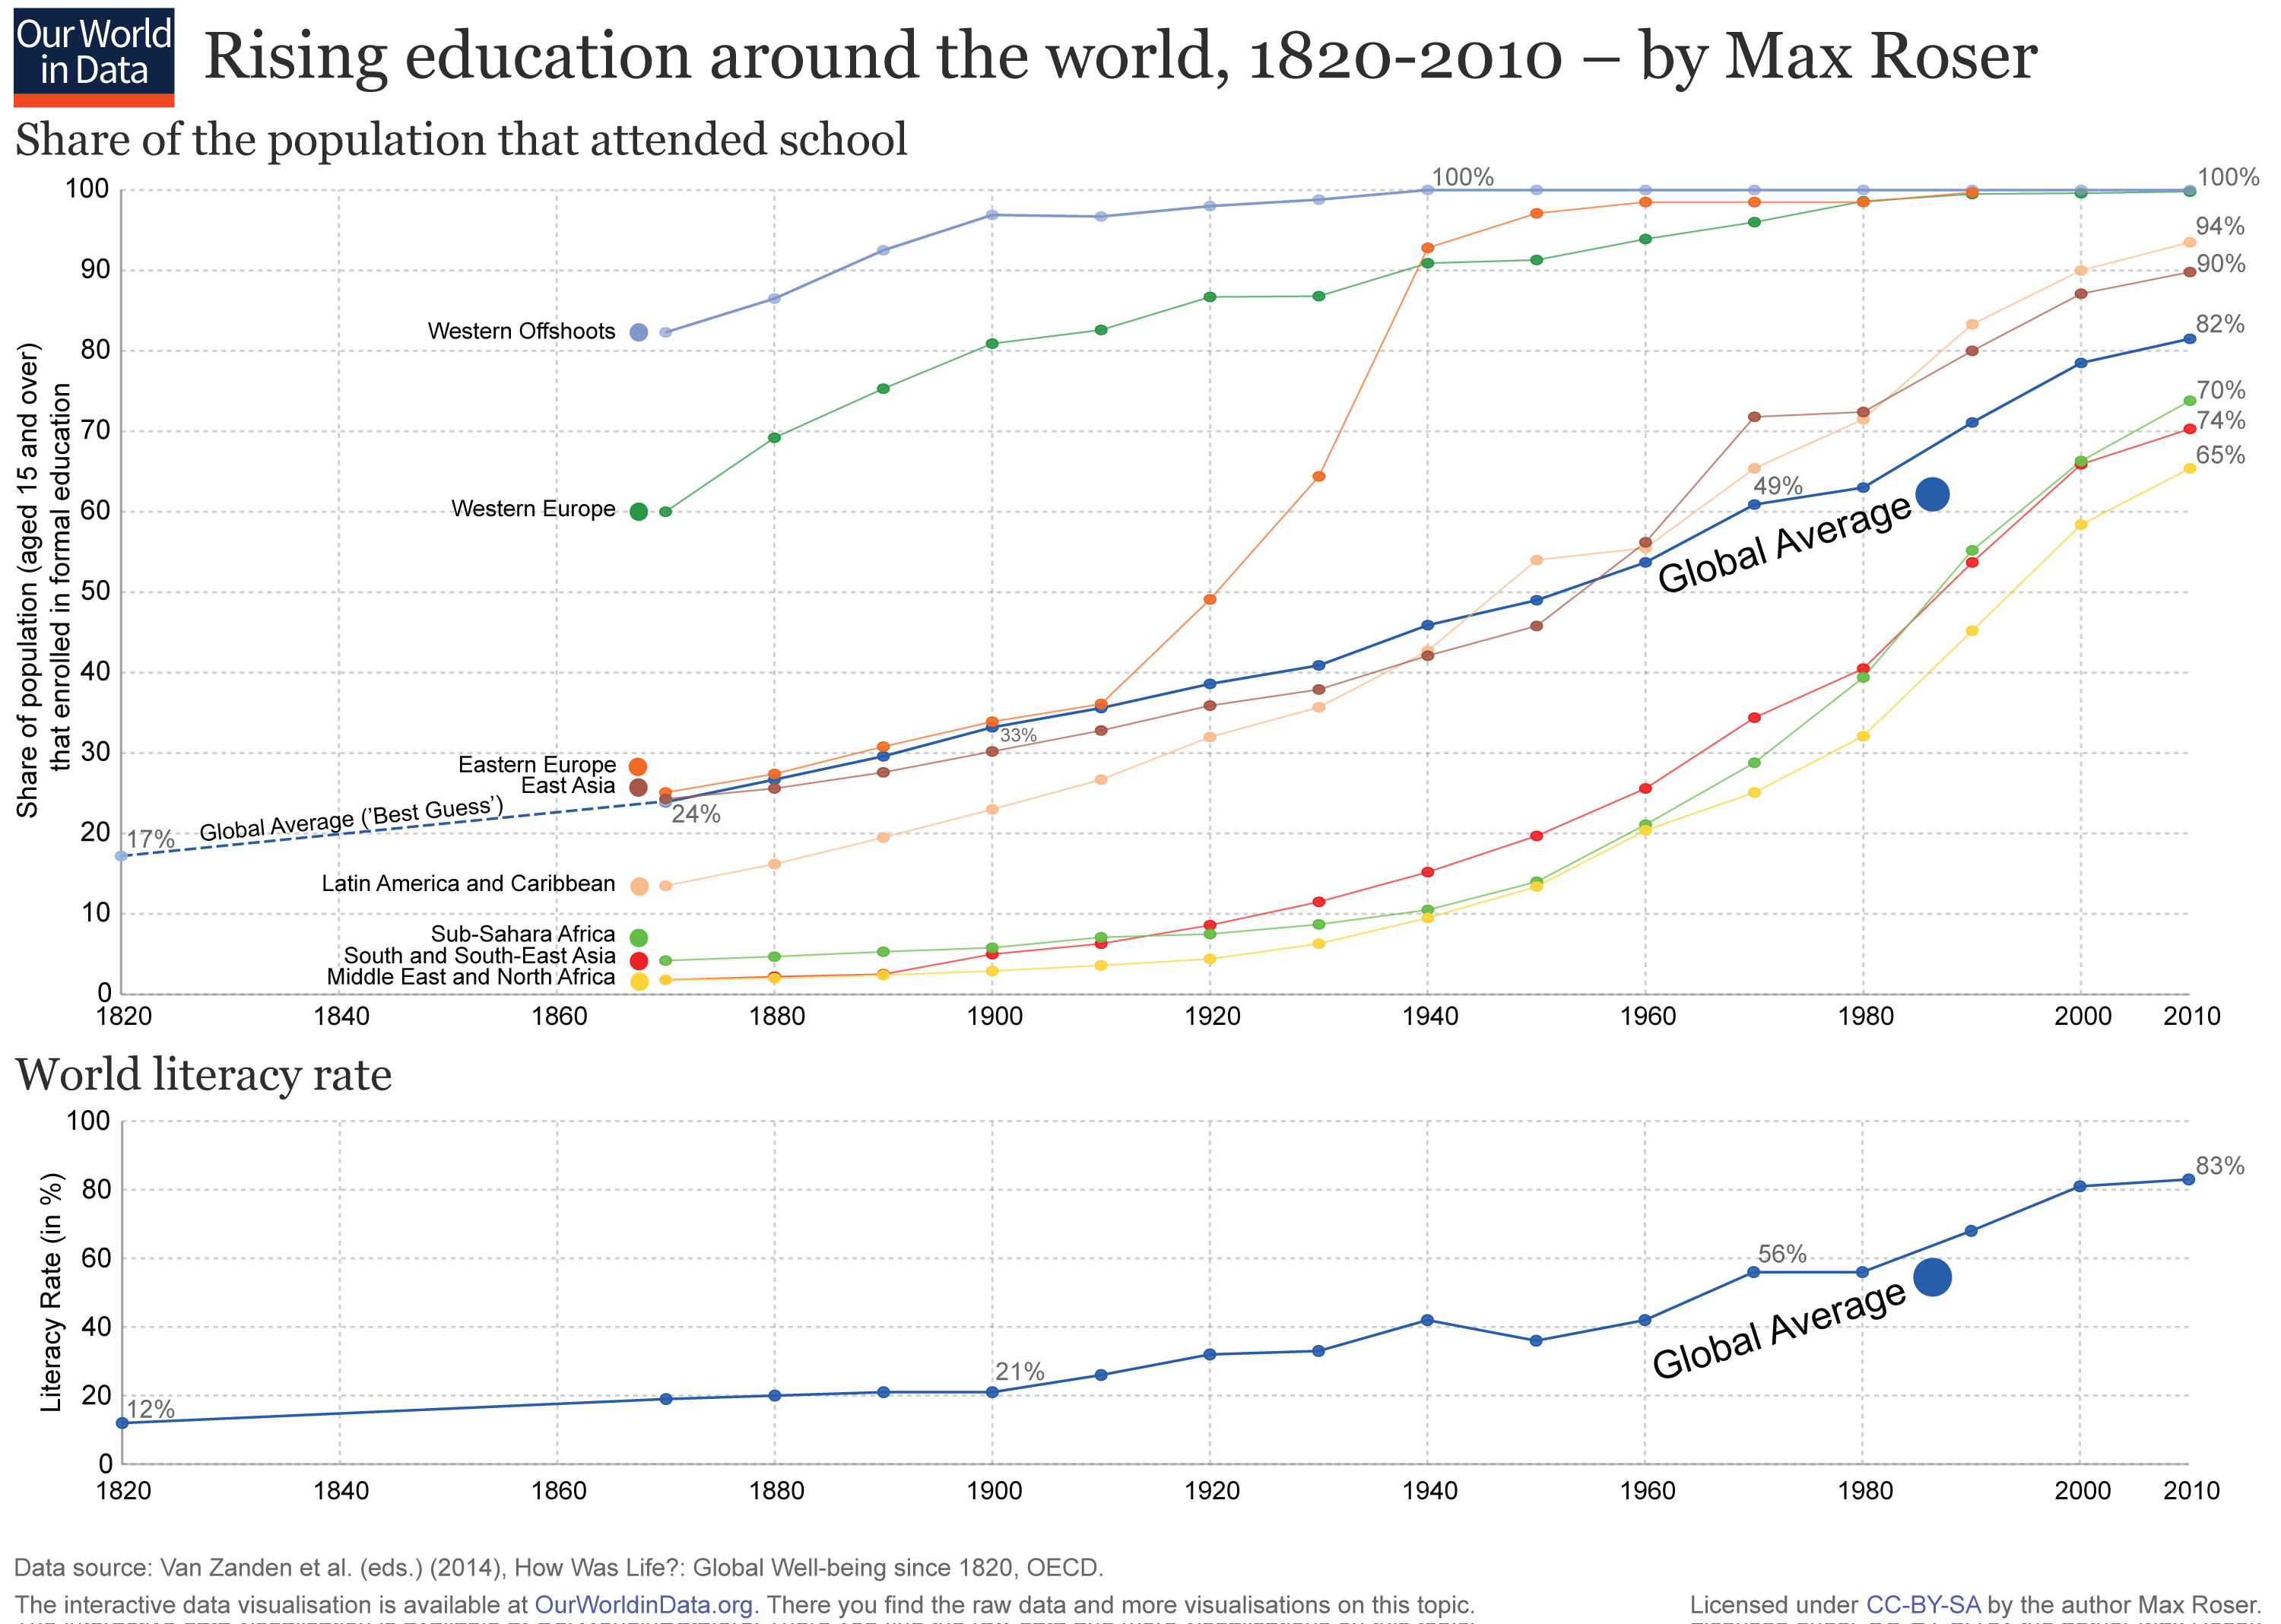
The following visualization presents estimates of world literacy for the period 1800-2014. As we can see, literacy rates grew constantly but rather slowly until the beginning of the twentieth century. And the rate of growth really climbed after the middle of the 20th century, when the expansion of basic education became a global priority. You can read more about the expansion of education systems around the world in our entry on
Financing Education.
When did literacy start growing in Europe?
The following visualization shows the spread of literacy in Europe since the 15th century, based on estimates from Buringh and Van Zanden (2009)
2. As it can be seen, the rising levels of education in Europe foreshadowed the emergence of modern societies.
Particularly fast improvements in literacy took place across Northwest Europe in the period 1600-1800. As we discuss below, widespread literacy is considered a legacy of the Age of Enlightenment.
Literacy rates around the world from the 15th century to present – Our World in Data, with data from various sources3
Full screen view Download Data
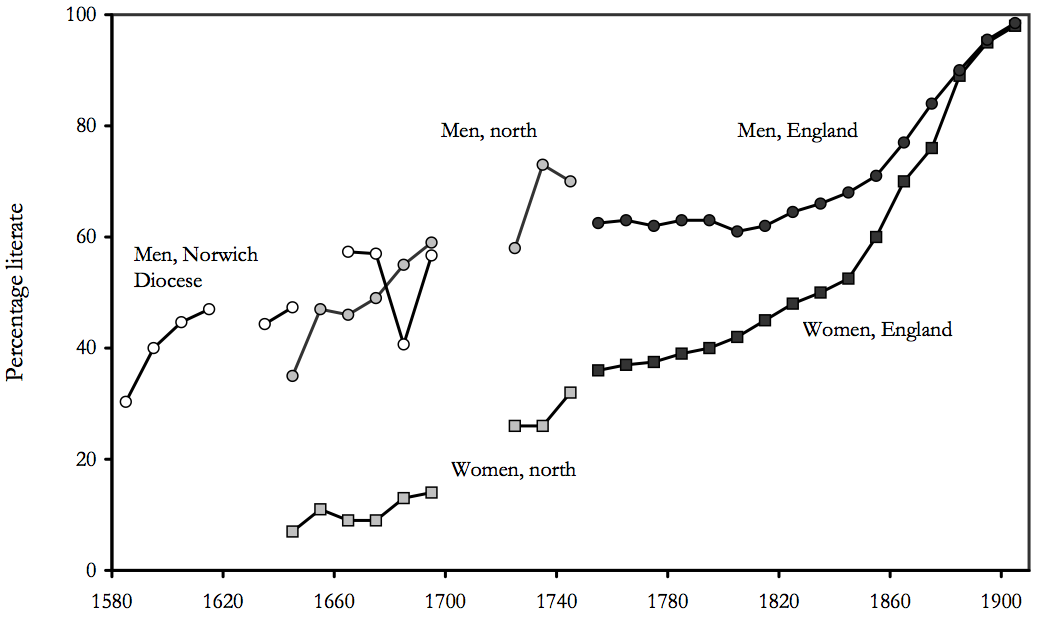
We have already pointed out that Northwest Europe made significant improvements in literacy in the period 1600-1800. Here we use historical estimates from England – a country that was very much at the center of the development of modernity – to show how the process towards universal literacy took place. Specifically, the following graph from Clark (2008)
4 shows how modernization – characterized by science, technological progress, freedom and tolerance – was enabled by improving the education of ever-larger shares of the population. It also shows how this process of expansion led to a reduction in education gender inequality.
Literacy in England, 1580-1920 – Clark (2008)5
In the US, the expansion of literacy helped reduce within-country inequalities
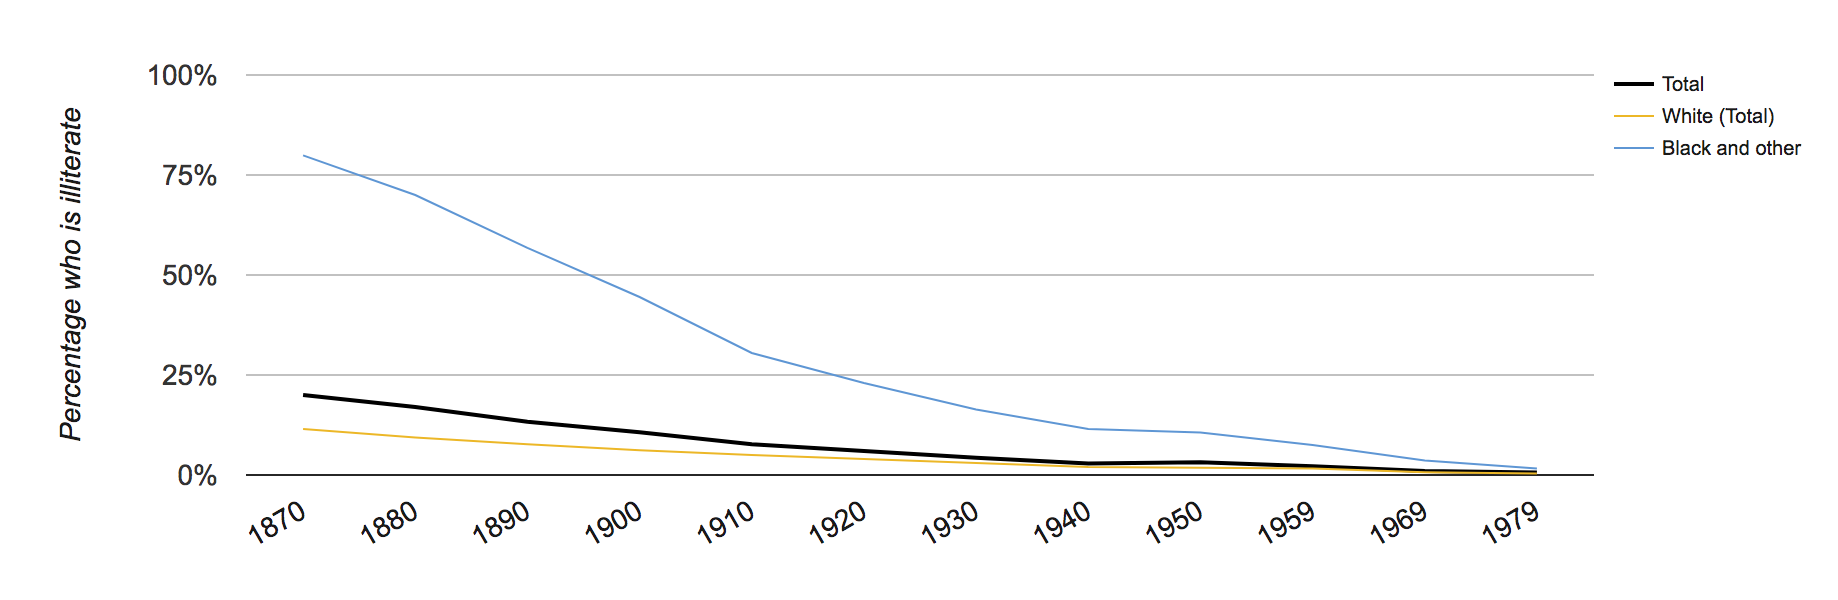
The expansion of literacy in early-industrialized countries helped reduce within-country inequalities. In the preceding visualization we showed that England virtually closed literacy gender gaps by 1900. Here we provide evidence of literacy gaps across races in the US.
The following visualization shows illiteracy rates by race for the period 1870-1979. As we can see, in order to reach near universal levels of literacy, the US had to close the race gap. This was eventually achieved around 1980.
Percentage of persons 14 years old and over in the US who were illiterate by race, 1870-1979 – Our World in Data, with data from NCES6
The global expansion of literacy has helped reduce inequalities both within and across countries
In our entry on
Financing Education, we show that an important consequence of the global education expansion is a reduction in education inequality across the globe.
Here we want to provide evidence of how inequality in literacy, specifically, has been going down. The following visualization shows literacy by age group for different country groups. The left panel corresponds to 1980, and the right panel to 1995.
We can see that all regions made substantial progress across the board – so the series in 1995 are much more compressed towards the top than in 1980.
We can also see that younger generations are progressively better educated than older generations. And it is particularly promising that this intergenerational change is happening especially quickly in the least educated regions of our world: notice how the slopes of the lines in the least educated countries become progressively steeper. We come back to an analysis of
intergenerational literacy gaps below.
In Sub-Saharan Africa in 1995, for example, the literacy rate for the youngest population group was more than three times higher than that for the oldest population group. It may seem obvious, but it is still worth pointing out that in all the statistics shown here we have never seen a reversal of this positive development.
Literacy by age group for different country groups, 1980 and 1995 – UNESCO7
I.2 Recent Developments
Latin America has made huge improvements in literacy in the last century
As pointed out above, Europe pioneered the expansion of basic education – but global literacy rates only started really climbing in the second half of the 20th century, when the expansion of basic education became a global priority. Here we present evidence of important recent achievements in Latin America, where literacy has dramatically increased in the past century.
As it can be seen, many nations have gained 40-50 percentage points in literacy during this period.
Despite these improvements, however, there is still a wide disparity between nations. Here you can see that, at the turn of the 21st century, half of the population in poor countries such as Haiti remains illiterate. This motivates the next visualization, where we discuss cross-country heterogeneity in more detail.
Adult illiteracy rates in Latin America, 1900-2000 – Our World in Data, with data from OxLAD8
Full screen view Download Data
Global literacy is higher than ever – but important challenges remain
The following interactive map shows literacy rates around the world, using recent estimates published in the CIA Factbook. As it can be seen, all countries outside Africa (with the exception of Afghanistan) have literacy rates above 50%.
Despite progress in the long run, however, large inequalities remain, notably between sub-Saharan Africa and the rest of the world. In Burkina Faso, Niger and South Sudan – the African countries at the bottom of the rank – literacy rates are still below 30%.
In most countries there are large generational literacy gaps favouring the young
To assess the extent to which progress can be expected in the years to come, it is convenient to break down literacy estimates by age groups. The following map, using data from UNESCO, shows such estimates for most countries in the world.
As it can be seen, in the majority of nations there is a large difference in literacy rates across generations (you can change the map to show literacy rates for different groups by clicking on the corresponding buttons at the top).
These large differences across generations point to a global trend: the high literacy rate among the youth indicates that as time passes, the literacy rate for the overall population will continue to increase.
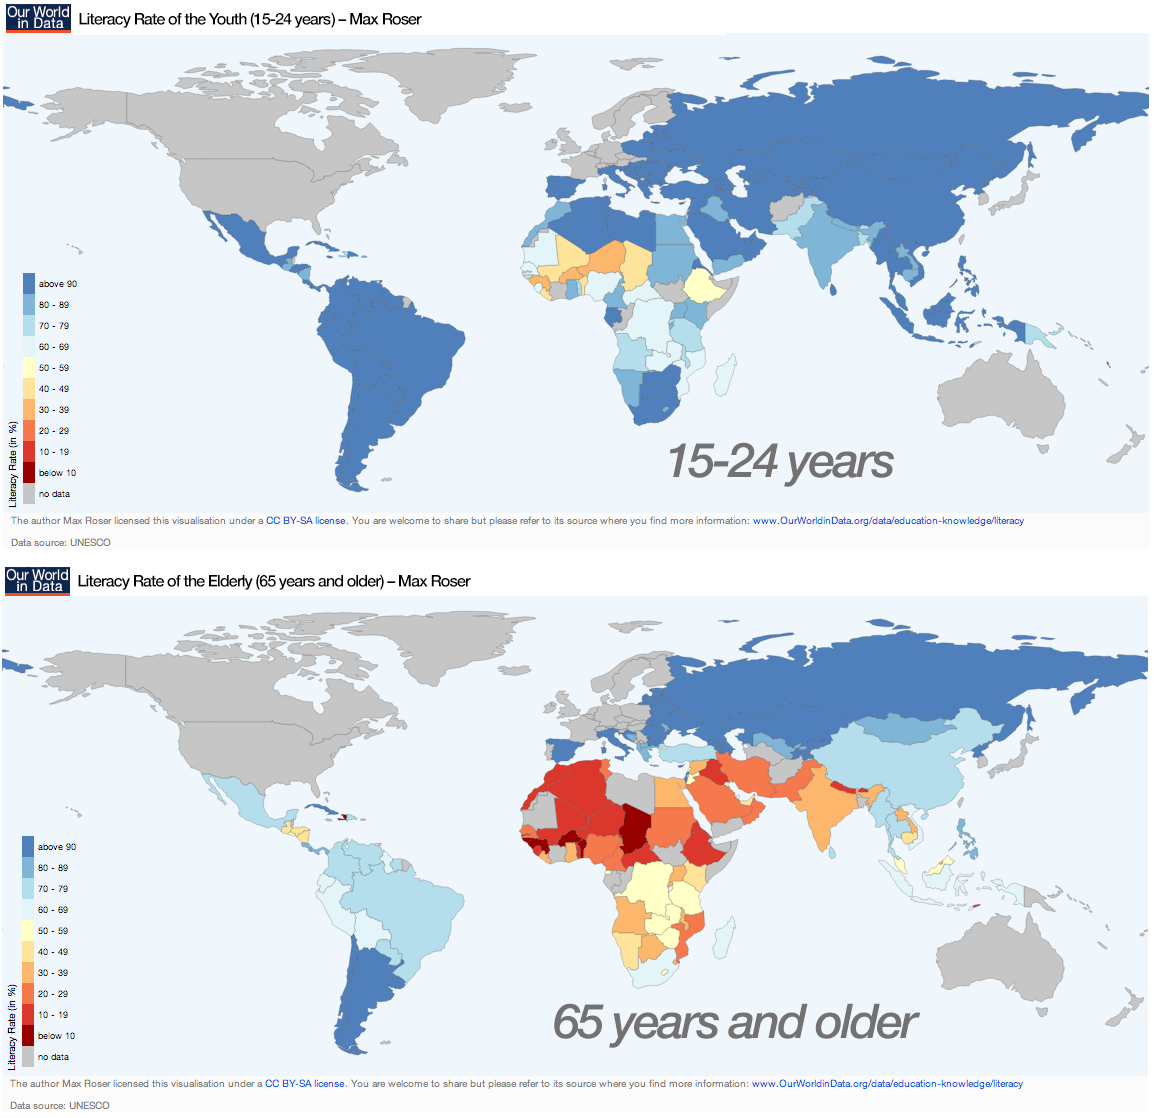
World maps of the literacy rate by age group – Our World in Data, with data from UNESCO 9
Full screen view Open in new tab Download Data Download the 2 world maps showing the literacy of the older and the younger generation
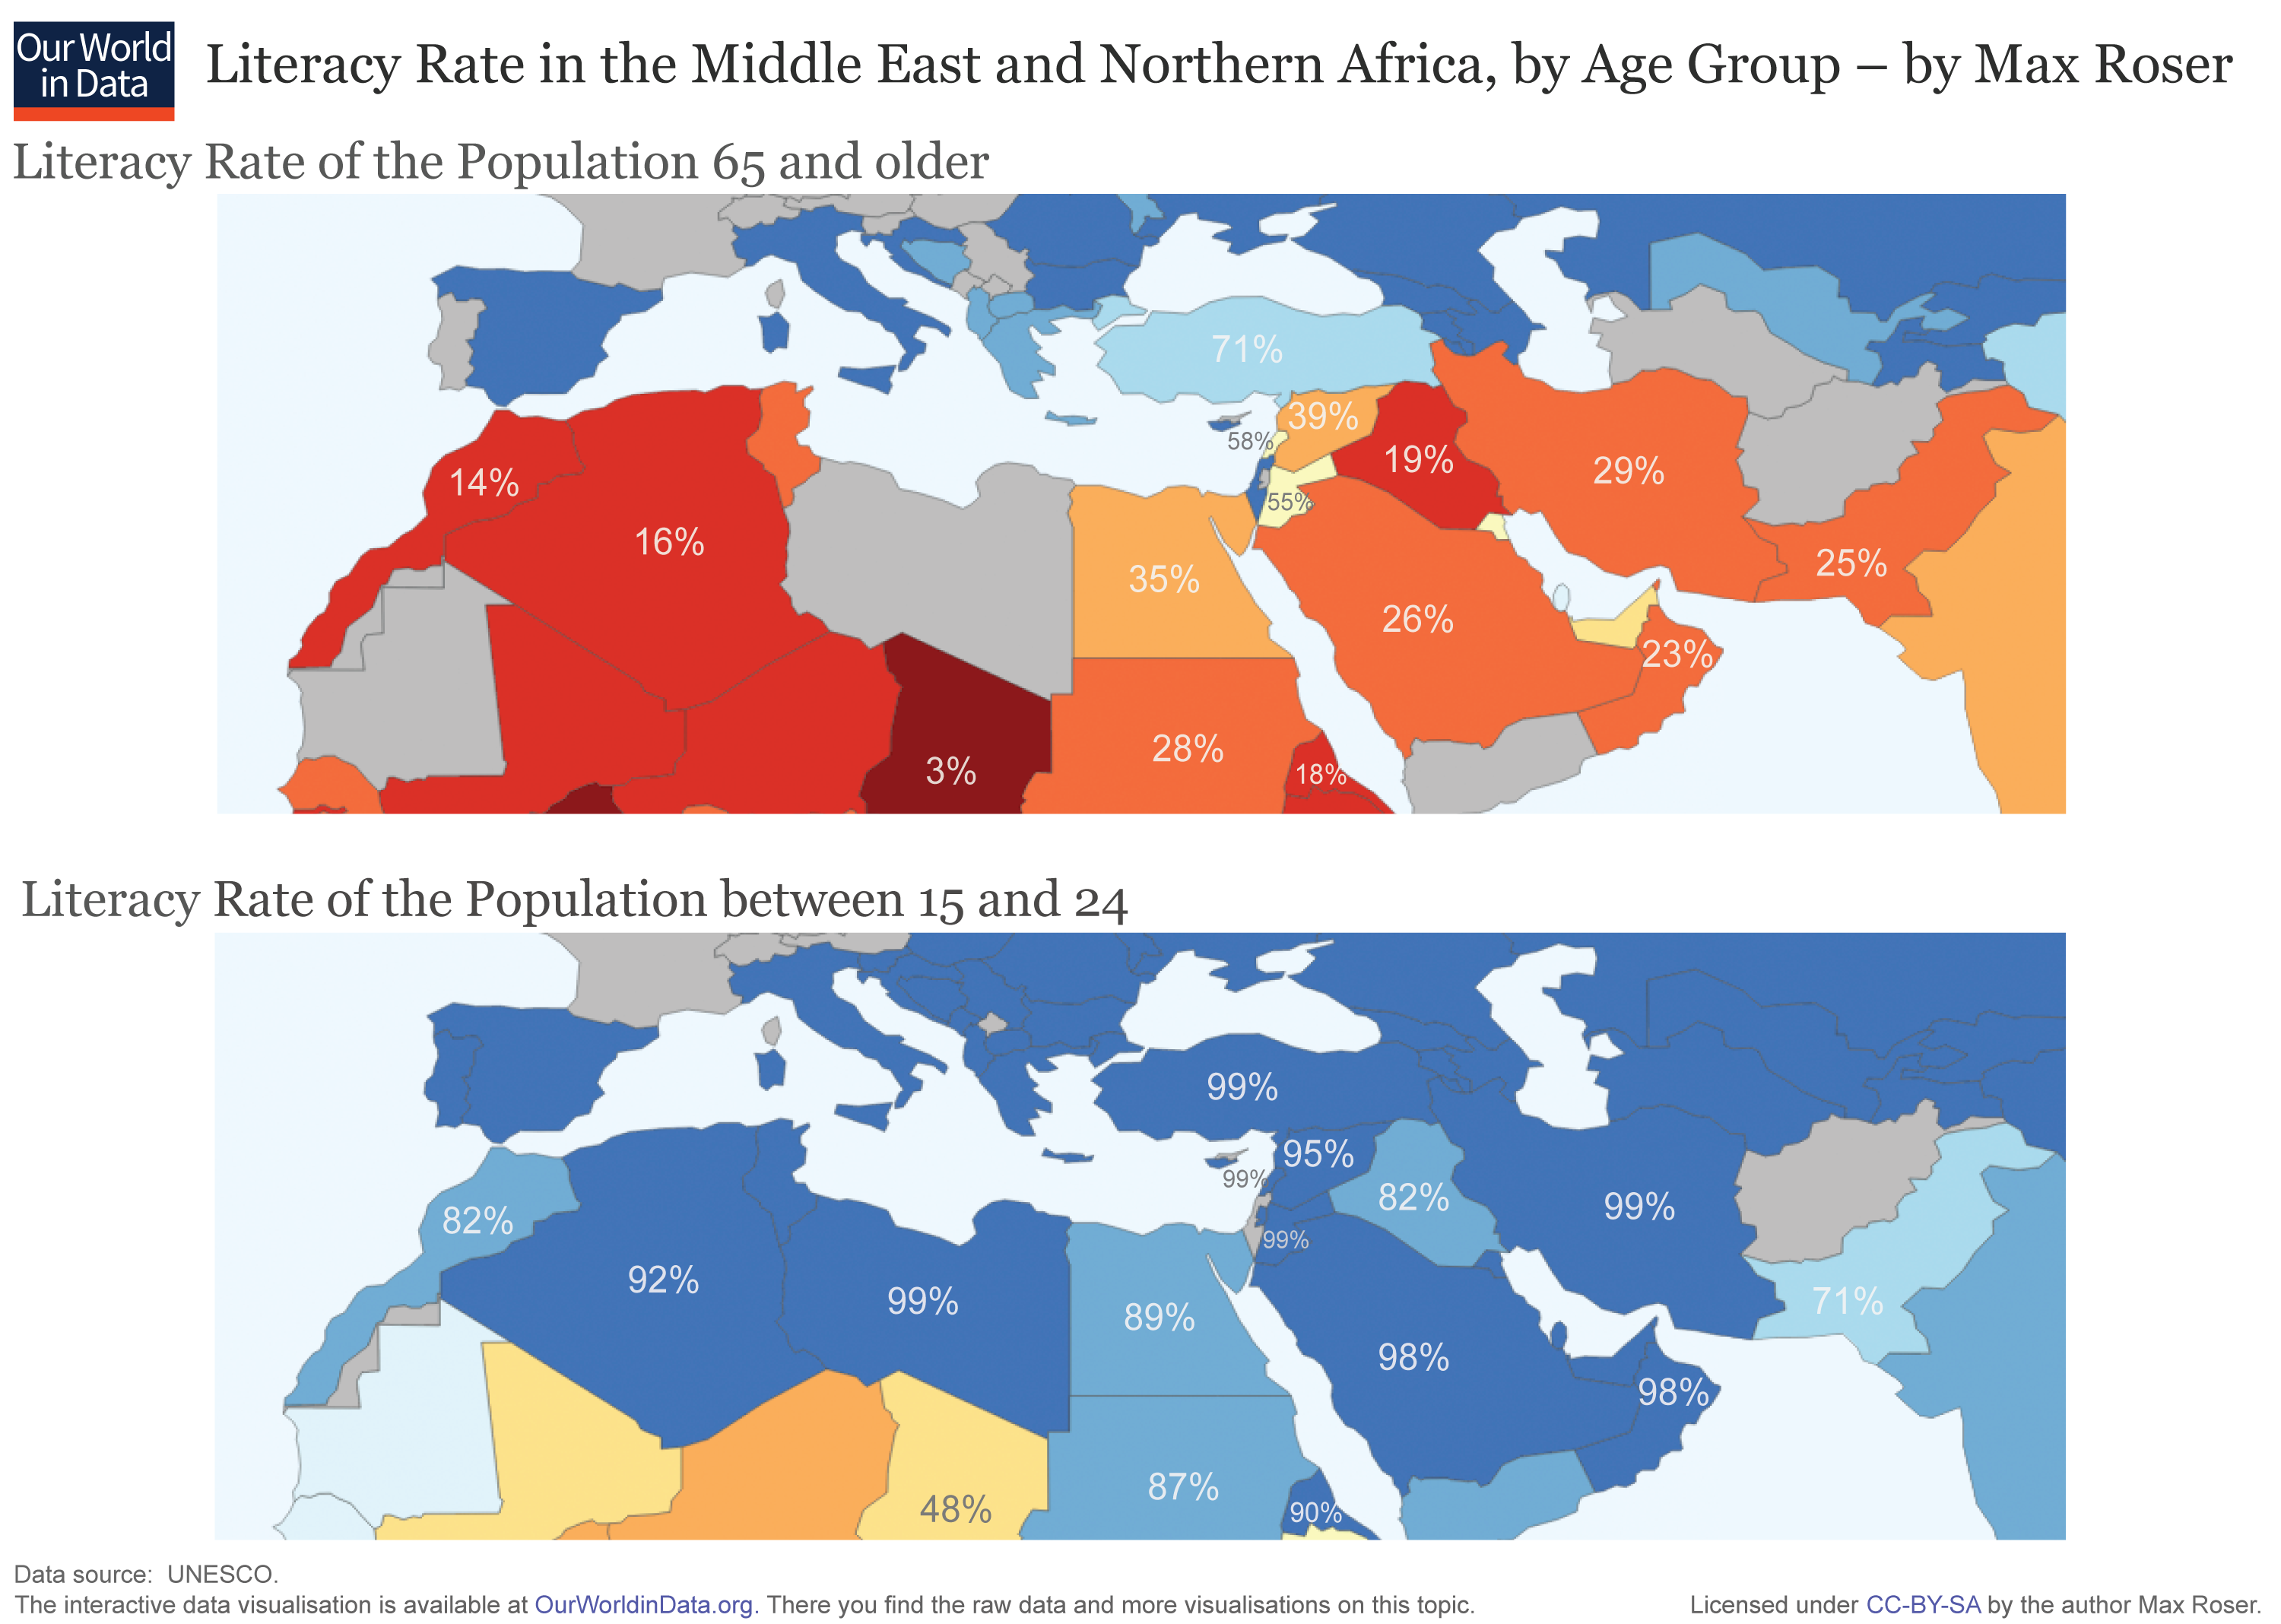
Northern Africa and the Middle East have drastically improved literacy in just one generation
We highlighted above the fact that most low and middle income countries feature large differences in literacy rates across generations. The visualization below shows specifically how remarkably large these differences are in Northern Africa and the Middle East. Using UNESCO data, these maps show that in many countries in these regions, only less than a third of the older generation is literate – while in contrast, more than 90% of the younger generation is literate.
The following scatter plot emphasises the point already made. As you can see, younger generations are more likely to be literate than older generations around the world. And in some countries the gaps are dramatic. In Algeria, for example, the literacy rate among the youth (15-24 years) is close to 97%; while it is 28% among the older population (65+ years).
Literacy by sex
The visualization below shows that particularly in many poorer countries the literacy rate for young women is lower than the rate for young men.
This chart shows the literacy rate by sex over time.
This visualization shows the ratio of the literacy rate between young women and men around the world.
I.3 Numeracy
Increasing numeracy skills over the long run
Numeracy is the ability to understand and work with numbers. The visualization below shows how this basic ability became more common in populations around the world based on a very basic definition of numeracy, the ability to correctly state one's own age.
Numeracy skills today
Compared to the data on literacy we have less information on numeracy skills in the world today. Some information comes from PIAAC, the OECD's survey of the skills of adults. A world map of these scores can be found
here.
The scatter plot shows how adults in OECD countries scored in the literacy and numeracy dimension. We see that the two aspects are closely correlated, those countries that have high literacy also have high numeracy.
PIAAC is only available for the very recent past, but it can still give us some insights of how numeracy skills in the world have changed. If we compare the numeracy scores of the young cohort with the older cohort
in a scatterplot we find that in most countries numeracy skills have recently increased.


Comments
Post a Comment